GOV.UK Design System Flow Diagrams for Figma
A resource to help teams show the interaction design of services.
Just looking for the Figma file? - Skip to the download details
What is a flow diagram?
I imagine most of my readers will know what a flow diagram is (also known as a flowchart) but just for completeness‥
A flow diagram visually displays interrelated information such as events, steps in a process, functions, touchpoints or ‘things’ that might be organised sequentially or chronologically.[1]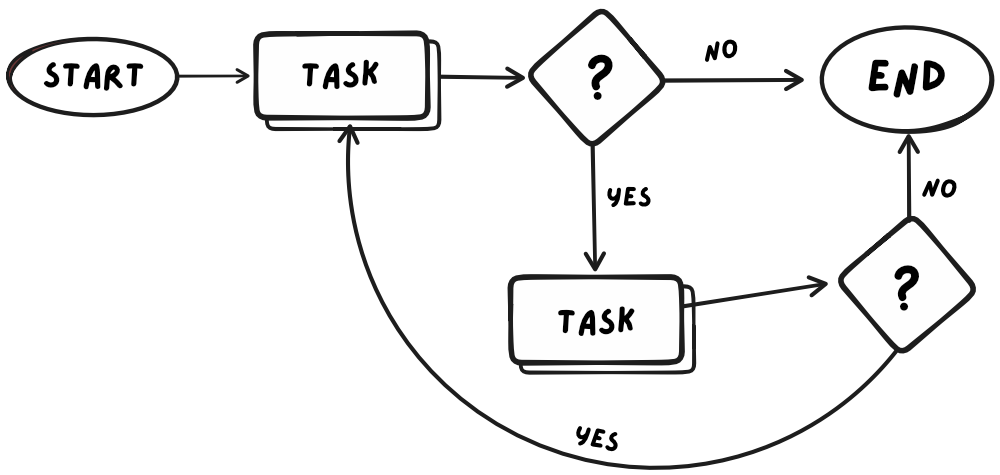
Flow diagrams reduce the amount of brain power (cognitive effort) required to understand complex information by showing it to us visually rather than describing it in written or verbal form.
Using flow diagrams to design services
Interaction designers often create a particular type of flow diagram called a “user flow diagram” (or ‘user flow’) to show what happens during a user’s interaction with a product or service.
Flow diagrams help to make facilitating and documenting decisions about services much easier by presenting us with the steps that happen, when they happen, and how they happen.
That said, flow diagrams should be created with care or they risk being more of a hindrance than a help.
To be understood more widely, they should follow some basic flow diagram conventions.
GOVUK Design System Flow Diagrams
Diagrams can be time consuming to create so it helps to have some prebuilt templates ready to go.
Thankfully the lovely and active GOVUK design community have created and shared template flow diagrams for others to use.
One that has stood the test of time and is available in various formats is the ‘GOVUK Design System Flow Diagram’.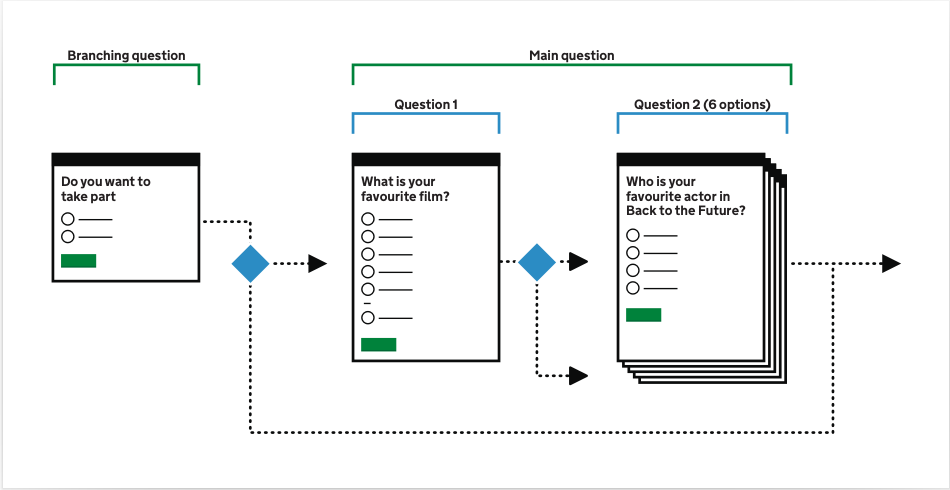
Why these diagrams work well
I personally find this style of flow diagram for interaction design much easier to read.
In the past I’ve heard this style called a ‘wire flow’ because the way they are drawn not only shows the steps in the process, but also the layout of individual screens as elements within the diagram.
Which I think is a key feature of these diagrams because the visual representation of the page helps people recall and differentiate parts of the user journey much more easily.
Credit to the community
I tried to establish who to credit for creating the original version but found that it was community as a whole, collaborating and sharing resources which led to this style of visual flow vocabulary.
The twitter thread was fascinating and served to remind me of why it’s important to work in the open, share learning and resources. We all benefit when that happens.
Adding superpowers to user-flow diagrams with Figma
So we arrive at my contribution, a version of the GOVUK Design System Flow Diagrams but enhanced with the capabilities of Figma.
Figma is great for creating visuals but it combines that with simple to use tools to help designers to create interactive prototypes.
The ability Figma provides to create easily customisable prototypes is what I have used to give some additional superpowers to the govuk flow diagrams we know and love.
Easily add and customise flow steps
In other tools such as Miro, Mural, Google Draw, etc just adding the steps and customising them can be cumbersome because you need to edit the graphic elements for each one.
Finding the correct layer is tricky, moving things means having to move related elements and so on. A simple wording change could lead to 5 minutes tweaking the graphic.
I’ve ported the flow diagram assets into Figma and then made use of features such as ‘auto-layout’, ‘properties’ and ‘variants’ to make this much easier.
Add visuals for other touch points in the flow
I’ve seen versions of the the flow diagram where the designer has wanted to indicate something outside the digital interaction such as:
- Waiting for something
- Sending or receiving an email
- Speaking to somebody in person or on the phone
In this Figma file I’ve added icons with optional labels which can be dragged into the flow to indicate common scenarios.
Zooming in and out of flow detail
Interactions can sometimes be quite complex, containing lots of routes and loops depending on the scenario being depicted.
This leads to very long and hard to follow diagrams. Writing as somebody who has produced many of them I’ve wanted a way to mitigate this for quite a while until I realised that this could be achieved in a tool like Figma.
Using Figma’s prototyping tools. You can create flows showing different levels of detail by drawing them on different frames and then linking them together.
See the video here. A frame showing the high level flow contains visual representing a stack of pages, known as a ‘compressed flow’.
This should tell the viewer that there are steps being summarised at that point which can be explored by clicking to drill down further.
This gives impression of zooming in when following the flow diagram and means you should be able to more easily manage changes to the flow by compartmentalising sections of it and then linking them together.
Where to download the GOVUK Flow Diagram for Figma
At the time of writing, I have released V1.0 of the Figma file.
Happy diagramming and do share any feedback or thoughts on twitter or as an issue in Github.
- Make a copy from the Figma community file
- Get the GOVUK Design System flow Diagram for Figma on Github.